Key Metrics
The complete metrics framework for measuring content test performance — from top-of-funnel awareness to downstream conversion.
Real-Time Metrics Overview
A snapshot of the key indicators across all active content tests — updated every 15 minutes from platform APIs.
The Metrics That Actually Matter
Not all metrics are created equal. Here are the nine metrics we track for every content experiment — ranked by predictive power for long-term content success.
3-Second View Rate
Hook StrengthThe percentage of viewers who watch at least 3 seconds of your video. The primary indicator of hook effectiveness and scroll-stopping power.
Click-Through Rate (CTR)
Conversion SignalThe ratio of clicks to impressions. Measures how effectively your CTA and overall content drives action. The strongest scale-readiness signal.
Watch-Through Rate
Retention SignalAverage percentage of video watched across all viewers. High watch-through rates signal algorithmic boost eligibility on most platforms.
Engagement Rate
Audience SignalLikes + comments + shares + saves divided by reach. A composite metric of audience quality and content resonance — use for cross-content comparison.
Share Rate
Virality SignalThe ratio of shares to impressions. The highest-value engagement action — shares indicate content that audiences feel compelled to distribute.
Save Rate
Utility SignalSaves as a percentage of reach. Indicates high perceived value — viewers saving content want to return to it, a strong signal of informational quality.
Follower Conversion Rate
Growth SignalNew followers gained per 1,000 non-follower impressions. The best metric for evaluating whether a piece of content builds your audience sustainably.
Cost Per Result (CPR)
Efficiency SignalFor paid amplification of winning organic content — the cost per desired outcome (click, lead, sale). Use to evaluate whether to scale ad spend.
Scroll-Stop Rate
Attention SignalImpressions that resulted in any interaction (pause, tap, hover) divided by total impressions. A broader measure of thumb-stopping power.
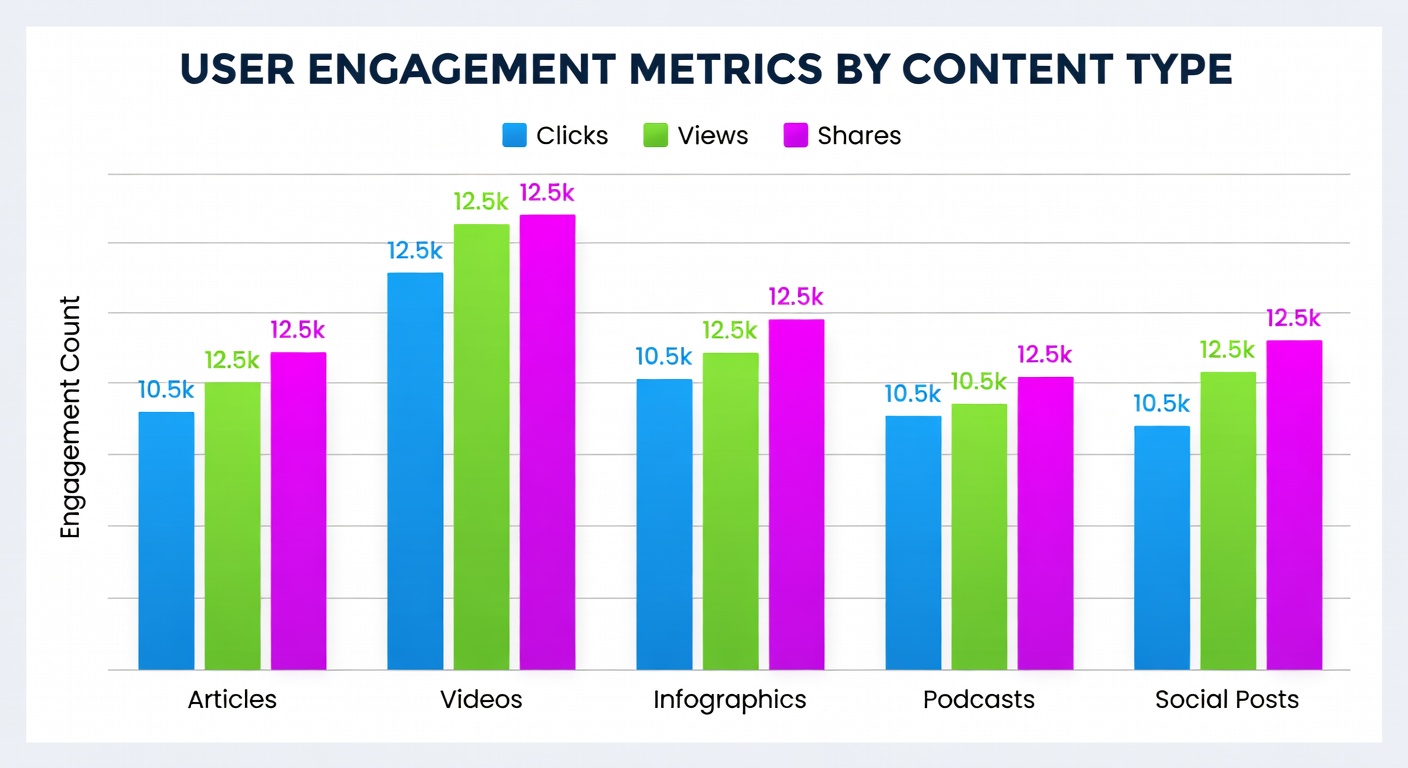
Engagement Metrics That Predict Long-Term Growth
Vanity metrics like raw view counts can be misleading. Our engagement metric framework focuses on the signals that predict sustainable audience growth and algorithmic amplification.
- Weighted engagement scoring across all action types
- Platform-specific benchmarking for accurate comparison
- Cohort analysis to track audience quality over time
- Correlation mapping: engagement → follower growth
Performance Testing Charts With Industry Context
Every metric we track is benchmarked against industry data by platform, niche, and content type. You always know not just how you're performing, but whether it's actually good relative to your market.
- Real-time benchmark comparison by niche and platform
- Percentile ranking for each metric (top 10%, top 25%, etc.)
- Trend line analysis to catch declining metrics early
- Alert system for metrics dropping below threshold
Platform Benchmarks by Content Type
Industry-validated benchmarks for the key metrics across major social platforms — updated quarterly from our aggregate client data.
| Platform | 3-Sec View Rate | Engagement Rate | Watch-Through | Share Rate | Tier |
|---|---|---|---|---|---|
| TikTok (Organic) | 60–75% | 6–12% | 35–55% | 1.2–3% | High Signal |
| Instagram Reels | 50–65% | 4–9% | 30–45% | 0.8–2% | High Signal |
| YouTube Shorts | 55–70% | 3–7% | 40–60% | 0.5–1.5% | Medium Signal |
| LinkedIn Video | 40–55% | 2–5% | 25–40% | 0.6–1.8% | Medium Signal |
| Facebook Reels | 45–60% | 2–4% | 28–38% | 1.0–2.5% | Lower Signal |
| Pinterest Video | 35–50% | 1.5–3% | 20–35% | 2.0–5% | High Share |
Track the Metrics That Move the Needle
Get our complete metrics framework configured for your platform and start making data-backed scaling decisions.
Request a Metrics Audit